10.03.2021
 1134 viewing
How to Use A/B Testing to Increase Profits and Improve Product Metrics
Split testing is good, but you need to know how to use it. Colleagues from the IT company Wowmaking tell us how to form a hypothesis, test it, and interpret the results.

Product development is a constant search for answers to the questions what can be improved, what will help increase profits, and in which direction it is worth moving. The only correct way not to harm the product with changes is to conduct A/B tests and make decisions based on the received data.
IT product company Wowmaking has been creating mobile applications for about three years, which are downloaded by millions of users around the world. We constantly conduct A/B tests of our products and advertising campaigns, so we are ready to share our recommendations and examples.
What is the essence of A/B testing
Conducting A/B tests helps you compare different solutions that you plan to implement in a product and choose the most effective one. This method protects you from making decisions that will have negative consequences.
How do we A/B test products at Wowmaking? It looks like this. We prepare two options, for example, application icons, which differ in color: one in dark colors, the other in light ones. We show parts of the audience (for example, 20 thousand users) option A, the rest option B. We measure the indicators: how many users clicked on the light icon and how many click on the dark one. We analyze the results and decide which version of the icon is better to use.
Where to look for test ideas
Ideas are generated and tested on an ongoing basis. We have created a separate team whose goal is to deeply analyze the product, market, and users and develop ideas for testing. In addition, product teams generate product development ideas themselves and validate them with A/B tests.
To form hypotheses for testing, we mainly analyze the AAARRR (Awareness, Acquisition, Activation, Retention, Revenue, Referral) marketing funnel. This allows us to focus on weak points rather than ones we like best or where we have more ideas. Here are a few words about each stage.
Awareness. Here we look for ideas for new commercials and banners.
Acquisition (buying traffic). We put forward hypotheses about what other channels can be used and how targeting can be improved.
Activation. For this stage, we look for ideas that will help as large a percentage of users as possible understand how our product solves their problems.
Retention. In this part of the funnel, we look at already activated users. Their returns are influenced by the product itself and the ways in which we return them.
Revenue. It’s time to test the monetization model (subscription, in-house purchases, advertising, or hybrid model) and do deeper tests when the model is determined (prices, points of sale, design of subscription pages).
Referral. In theory, if you get to this part of the funnel, you are already attracting a fairly large number of users to the product, some of whom have been using the product for a long time. Most likely, they are willing to recommend it. It remains to find a user-friendly method.
Examples of our tests
Most of our tests are aimed at testing hypotheses for improving user flow or user paths. Their goal is to bring as many users as possible to the point where they can understand the value of the product. If the user does not understand the value of the product, then most likely he will leave without recouping the cost of its attraction.
Among the Wowmaking products is the SRCH puzzle app. The team conducted many tests to find the ideal sequence, according to which you need to show levels of varying difficulty to new users. We tried to find a balance between fun simple levels and more difficult ones. The data showed that it is best to give the user the ability to choose which drawing to color and, at the same time, leave only three unpainted elements.

One of the tests in the Retention and Revenue funnel is choosing the level at which it is best to start showing ads. Our variants included the first, fifth, and tenth levels. Subsequently, the user group with the launch at the fifth level had the highest rates. At this stage, most of the users are already involved and ready to use the application on an ongoing basis, which increases the overall profit. Before the tests, this option seemed not the most successful, because we have financial losses at the first stages since there is a proportion of users who, despite the lack of advertising, will not reach the fifth level and will delete the application.
For our Mustread scary chat story app, we also tested various hypotheses about how to pick the first story for the user. They offered various formats where the user himself could influence the choice of the first story. Surprisingly, the highest indicators remain with the option when we do not leave the user with a choice but immediately send them to the reading screen of the story.
We continue to test new formats for selecting the first story for the user.

Test with the selection of the first story for the user in the Mustread application: option A wins at the moment
Many hypotheses have been put forward about the ways of monetization. Mustread uses a hybrid monetization model: We generate revenue from subscription sales and ad impressions. One of the places where ads are shown is between episodes within the same story. Studying user reviews and interviews, we periodically received negative feedback about advertising in this particular place. To test how this affects the product and how the majority of users feel about it, we ran an experiment.
Showing ads in the app does not spoil the product
Only new users participated in the experiment. For 50% of users, we’ve turned off ads between episodes. As a result, we saw that turning off ads does not lead to an increase in Retention nor in the number of episodes or stories read. At the same time, we lose about 30% of advertising income for the entire time the user uses the product. Now we are sure that showing ads between episodes does not negatively affect the product, and we are calm about isolated negative reviews in this regard.
We also test the design of the subscription pages. Many products use pages that sell multiple products at once: weekly, monthly, or yearly subscriptions. Some time ago, using an A/B test, we found out that selling multiple products on a subscription page has a positive effect on LTV.
But one of the features of such pages is that there is little space left on them to reveal the benefits that a subscription gives to the user. One solution is to show an additional screen before showing the subscription page, which will detail all the benefits. We tested this hypothesis and saw about 25% growth in subscription conversions on iOS. We also saw an increase in conversion to subscription write-offs and, as a result, an increase in LTV.
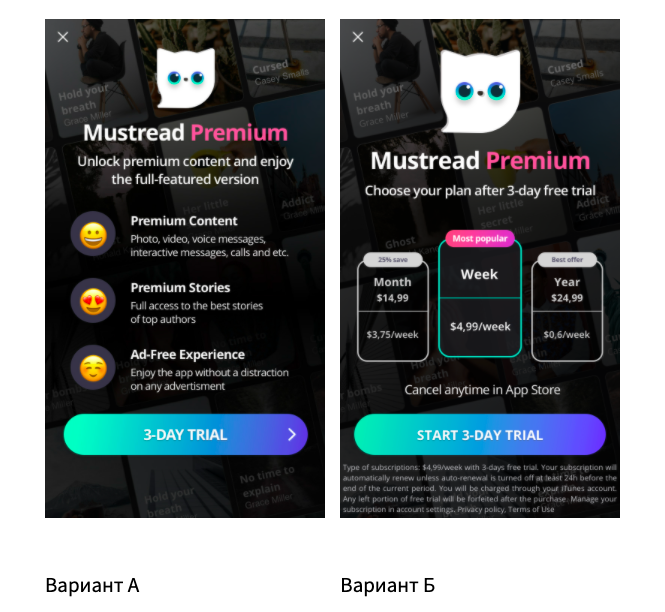
Subscription page with an additional screen revealing the benefits of the selected product.
How to do A/B testing
Experimenting requires careful preparation. The first step is to draw up a detailed plan, which will determine the sample size, flow of the test and control groups, the target audience of the experiment, and metrics and analytics events that we will use.
The next step will be the preparation of the design, texts, and all the testing elements that we need. We start the experiment and look forward to the results.
Before stopping the A/B test, the results must be checked for statistical significance. If the test is successful, then the solution can be implemented into the product. But you need to understand that a positive result shows 1 out of 10 hypotheses, so the more tests you carry out, the more growth you can achieve.
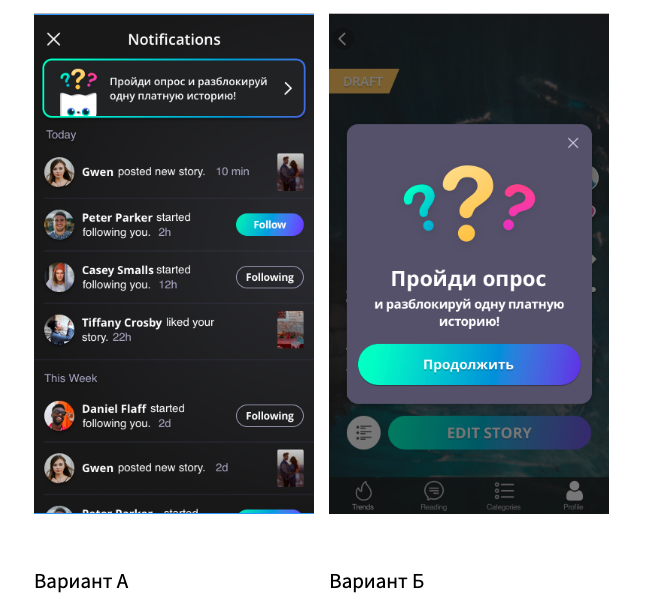
Test in Mustread, where we asked users to take a survey. The percentage of users who completed the survey is higher for option B. Both options do not negatively affect Retention.
Where is the best place to test mobile apps?
We tried different services and settled on Firebase. This is an analytics service for mobile applications from Google. Firebase has unlimited reporting events.
Regardless of the number of events, conversions, transactions, or users, you will be able to see the complete data. In the application, you can track conversions, profitability, and user behavior metrics. In addition to the standard parameters, you can customize more than 25 additional ones here. Most often, we use those related to the installation source (ad network, type of ad campaign, id of the ad campaign). We also analyze the installation date, whether the user has made at least one payment, and whether it is new or old (first installed the application or updated).
What mistakes can there be
No one is immune from mistakes, but it is better to know about them in advance and try to avoid them. Here are a few mistakes beginners can make.
1. Participants in the A/B test are chosen incorrectly.
Let’s say you are testing the tutorial on new users. You show both options to 50 thousand users, and you see that 40 thousand users have passed it in A and B options. The conversion in this case is 80%. And there seems to be no difference.
But if you look deeper, it turns out that in option A, the tutorial was shown to 46 thousand users and, in option B, to 43 thousand. In this case, the conversion looks different: A – 86.7%, B – 93.0%.
2. Results are not tested for statistical significance.
The difference between indicators A and B of user groups may be so small that it is impossible to draw adequate conclusions based on it. In order not to be mistaken, the test results must be checked for statistical significance. Some services for conducting A/B tests have built-in calculators for this. We also sometimes ask our analysts to check some test results for statistical significance.
For example, we are testing 2 different onboarding, where the key metric for us is the percentage of users who have completed it. Let’s say there are 1,000 users in the experiment: Each group has 500 users. In group A, the percentage of onboarding is 90% and, in group B, 86%. It may seem that option A is better, but until the result is statistically significant, it is too early to draw conclusions; you need to continue the experiment.
3. You don’t foresee how the results will be used.
Before starting the test, you need to think about how the results will be used. Otherwise, the test may turn out to be successful, but the implementation of the results into the product requires too many resources and does not make sense.
4. Erroneous metrics are analyzed.
You decide to test your hypothesis: As the number of ad impressions in the application increases, the profit increases. Revenue is chosen as the control metric. We begin to show more ads and see the growth of that very cherished metric. However, you have not taken into account that in the long term, such a policy can lead to a decrease in income due to the dump of users. To avoid this, you need to monitor the relative metrics of Retention, ARPU, and LTV.
Source: cossa.ru